Ref 1a: Add Data
Data types
In this course, we will be using vector and raster spatial data as well as images to complete our poster.
Vector data
Point
Population_centres Line
Rivers Polygon
Local Government Boundaries
SEQ boundary
Raster data
Geotiff
- current_distribution_RF_1.tiff
Additional data
Images
koala_1.jpeg
qld_tas_changes.png
qld_tas_fut.png
qld_tas_hist.png
scenario_3_lock_in.png
All text for the captions can be found in the content.txt
Loading data
Loading data can occur in multiple ways. For this course, we will use the Browser and the Data Source Manager.
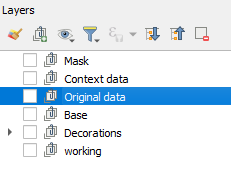
One of the important aspects to an efficient mapping product, is keeping it tidy. A way to do this is to create Groups in the Layers panel.
> - Create the above groups in the layers panel by right mouse clicking in the layer panel and selecting Add group. > 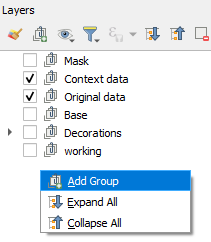
Browser
Accessing the data via the Browser panel, we will add the data to the groups. > - Ensure you have the Browser panel open.
> 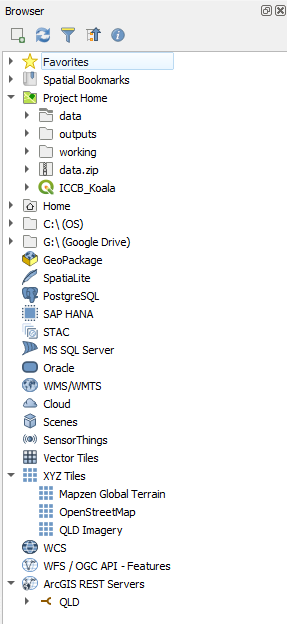
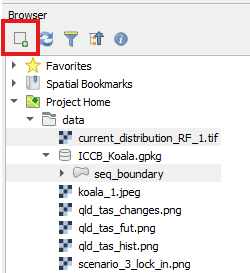
> - At the top of the Browser, click on the arrow next to Project Home to expand it
> 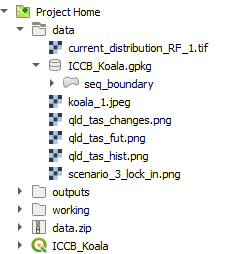
> - Expand the Data folder
We are going to select multiple files and load them under the group headings > - First, in the Layers panel, click on the group ‘Original data’
> 
> - Then head over to the Browser panel and whilst holding down the ctrl key, click on ‘current_distribution_RF_1.tif’, and the ‘seq_boundary’ (in the geopackage)
> - With all of these selected, click on the Add selected layer button at the top of the Browser panel
> 
> - This results in layers nested under the ‘Original data’ group
> 
Data source manager
We are going to access some data now from the service we have loaded. We can use the Browser panel to do so, but to select data that only occurs in the map extent. In this instance, our Area of Interest - South East Queensland.
> - In the Layers panel, select turn on the ‘seq_boundary’ layer
> - Right mouse click on the layer and select Zoom to layer
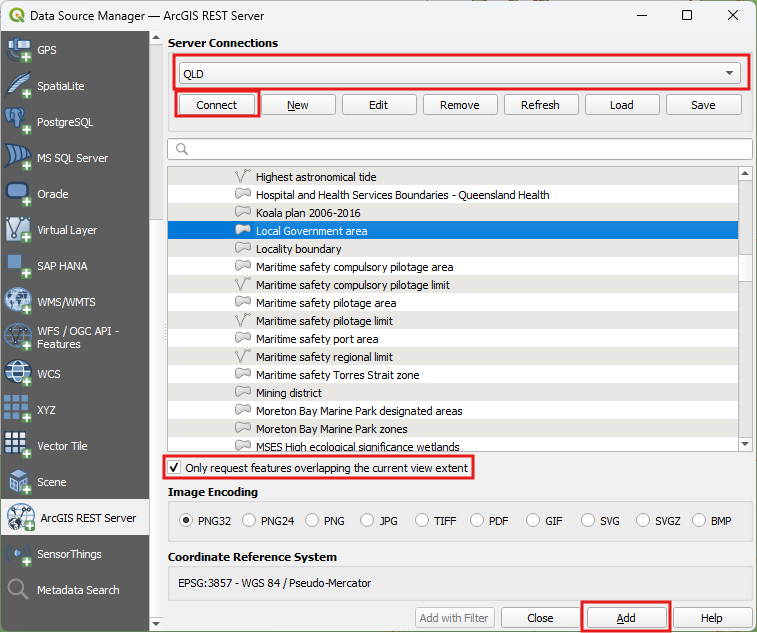
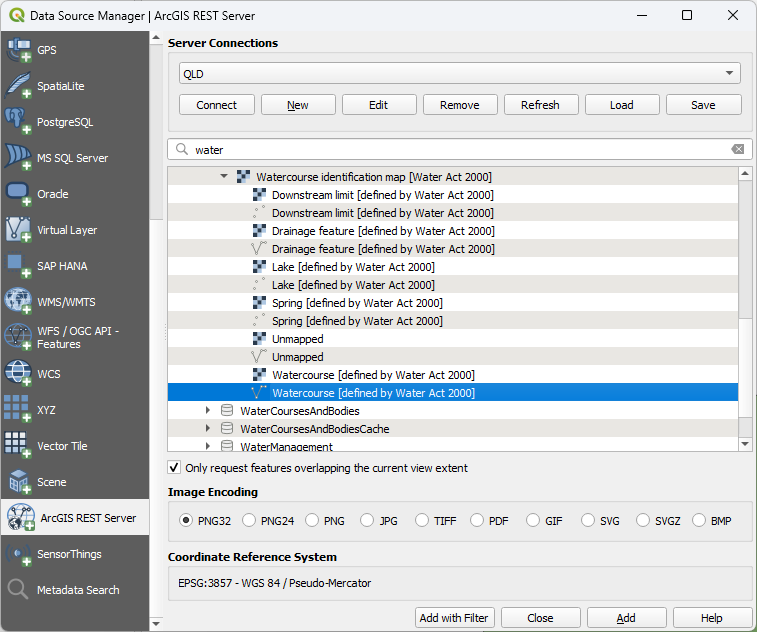
> - Click on the Open Data Source Manager' button >  > - On the left hand side of theData Source Managerscroll down until you see the ArcGIS REST Server and click on it > - On the right hand side, click the drop down and select 'QLD' (or whatever you named the Qld Spatial Government service) > - Click onConnect> - Click on Boundaries > AdminBoundariesFramework > Local Government area (you will need to scroll down quite a bit) > - TickOnly request features overlapping the current view extent> - Click onAdd`
>
We won’t close this yet as we need to add in watercourses.
- Above the layer list, there is a search bar, type in ‘water’, we are looking for polyline dataset for a river
- Expand ‘Inland River’ and select ‘WatercourseIdentificationMap’ > ‘Watercourse’
- Click
Add with Filter
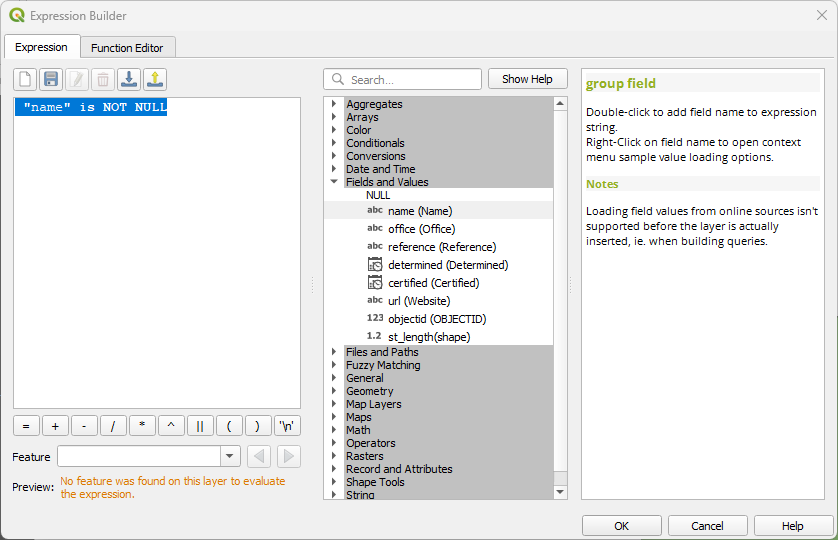
- The
Expression Builderwill come up. Add in the following"name" is NOT NULLand click onOK- Click
Add, thenClose- Turn off the watercourse dataset as we do not need it at the moment.
Now add in Population centres using the Data source manager - but be careful to select only those covering the extent.
- It is in the QLD service under Location > Places
- Use the search function to find it quickly